
Visualizing the Four Big Risks
A visual approach to assess and mitigate risks in product development

This is a lightly edited version of a guest post that was originally published on Product Weekend in December 2023

Roadblocks and risk profiles
Have you ever released a new feature, only to see it lowly engaged with, or not even found by most users? Or how about uncovering a meaningful opportunity only to realize that solving it would be a herculean task because it involves wrangling that one legacy service that no one wants to touch with a ten-foot pole? Or entering a new geographic market, only to realize that while the product works fine, the way it’s marketed and sold has to be completely adapted? While all represent roadblocks, the next steps will be entirely distinct for each scenario.
As a product team, we need tools to iteratively gauge our levels of confidence in an initiative’s likelihood of success. While this is a multifactorial process, in which we leverage quantitative and qualitative data, there’s a simple activity that I’ve been using for a few months now and that you could easily implement today. It acts as a conversation starter to ensure you and your team are aligned about the risk profile of your initiatives. Understanding these profiles lays the groundwork for a core aspect of product management: the process of de-risking.
De-risking is the lifeblood of product management
Product management is often about making the right investments. Any time we decide to pursue an opportunity—typically by building a piece of working code to address it—we’re investing resources that could have been allocated to every other opportunity.
Much like with financial investments, we want to maximize our potential return while minimizing the associated risks. It’s why we talk to customers, research the market, track usage behaviors, ideate multiple solutions, and iteratively release features, while continuously collecting feedback for further improvements.
All of this should be obvious, it’s why “build the right thing and build the thing right” is a mantra in product development, it’s why prioritization is a key focus area for PMs, and why the Lean Startup movement took immediate hold when it emerged over a decade ago.
We know de-risking is a key element for success from decades of research, best practices, and case studies, and yet…it’s still tough. Risk can often feel like a vague concept, which is why I think the best way to successfully minimize it is by being deliberate about it. I think this is partially why Marty Cagan’s four big risks resonated immediately with so many; it broke risk down into four components that are directly relevant to any cross-functional team. As a reminder, the four risks when working on a new initiative are:
Value risk: whether it will be useful enough that customers choose to use or buy it
Business viability risk: whether it’s meaningfully impactful and aligned with our business
Usability risk: whether it will be easy for customers to use
Feasibility risk: whether, realistically, we can build it with the resources we have
Even when aware of the risks, teams may share different frames of reference for risk thresholds: what does it mean for something to be high or low risk? This is why collaboratively discussing the efforts we’re making across the four risks is an essential step.
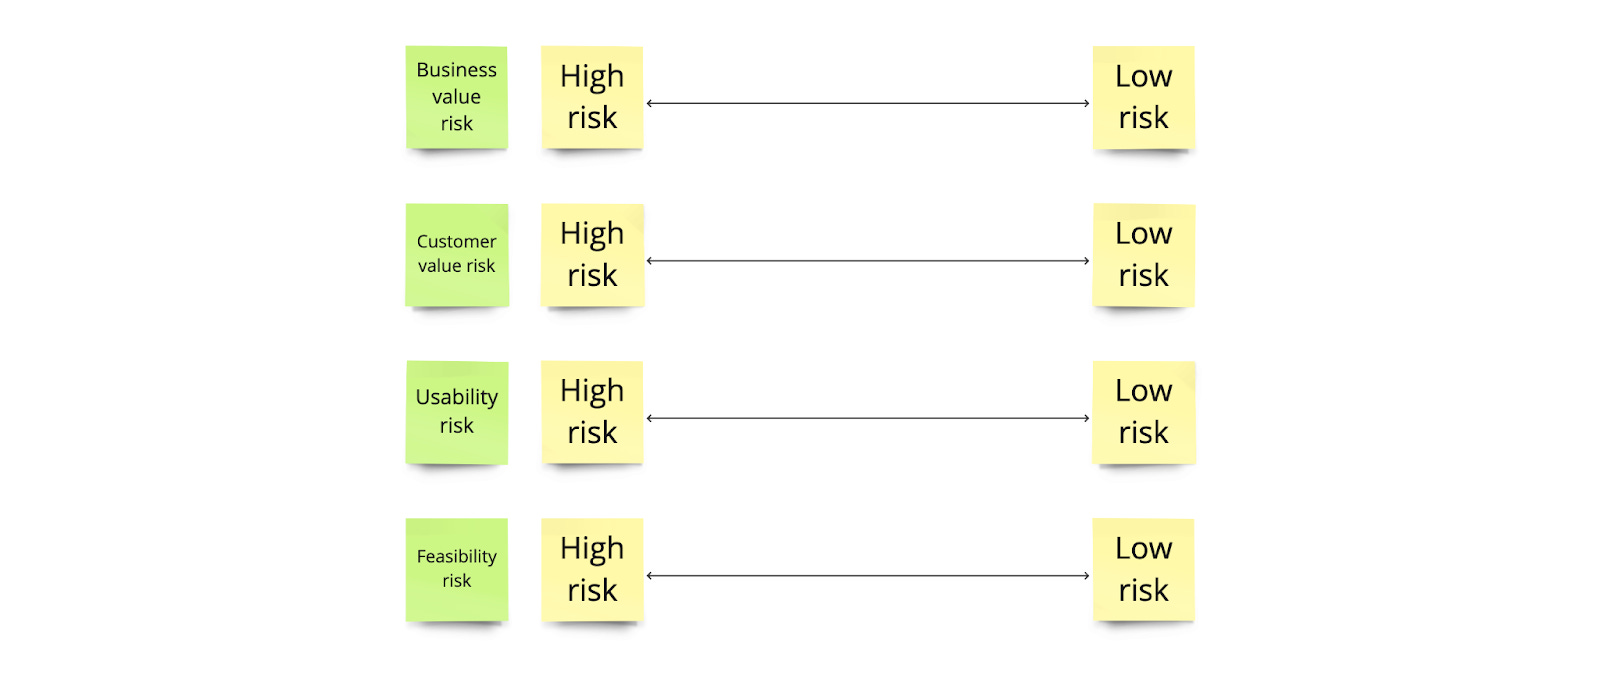
Enter the four risk sliders.
Visualize it to describe it
A while back, John Cutler shared a “bet conversation starter” activity that a team used to shape bets across 11 relevant parameters, each with its own slider to indicate where that bet fell. I loved the idea of compiling parameters that teams should discuss in a visual format. If “name it to tame it” is an effective concept on its own for wrangling complexity, it felt like visualizing it was the next logical step to promote shared understanding.
It was this activity that led our team to experiment with a way of easily visualizing the four risks, by plotting them on sliders, from “High risk” to “Low risk”. The goal was to have an extremely simple tool that facilitated conversations between the team, to identify the focus areas for de-risking, and to validate whether we were on the right track. In time, all four risks should lean towards “Low risk”, as we gain confidence that we’re building the right solution for the right opportunity.
As a real-life example from our team, who works in a B2B SaaS context, we’d identified a meaningful opportunity: our customers were struggling with decentralized communications with their end-customers. Our hypothesis was to build a centralized 2-way conversations feature within our product. Regardless of how thinly we sliced it, we were pretty sure it would involve at least a couple of weeks of development to set up a first working version. So, we wanted to make sure our assumed solution resonated with customers before actually investing the resources in building it. Again, we’re managing investments here, so “code as a last resort” is often a good motto to triage that we’re only building something if we’ve validated it.
So, to start, we mapped our assumptions for the current risk profile of our assumed solution:
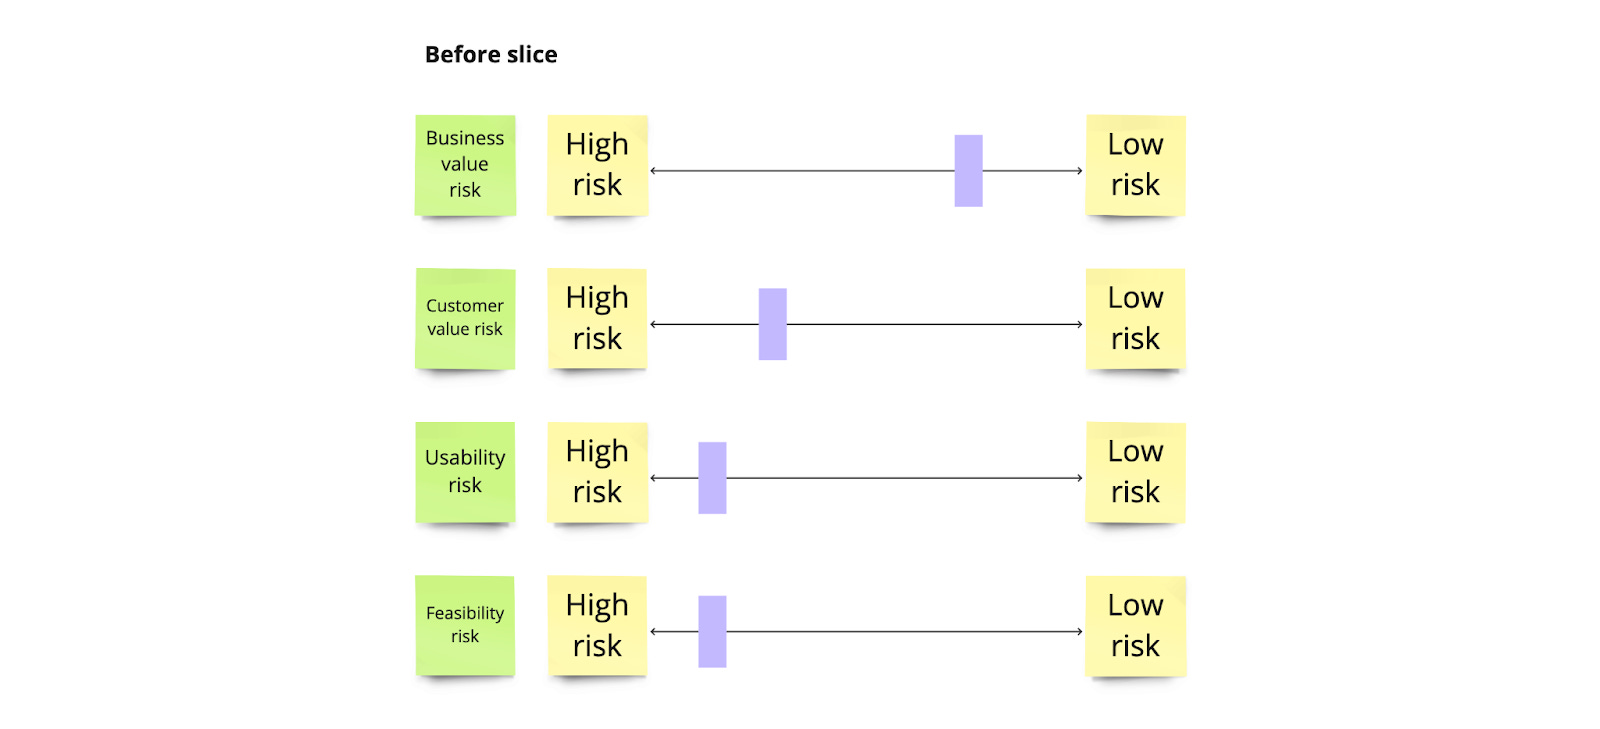
“Business value” we deemed relatively low risk, as the data validated this was a significant enough opportunity to nudge prospects and customers’ purchasing decisions. Additionally, solving this opportunity was completely aligned with our overall product strategy.
“Customer value” we set as moderately high risk. While conversations with customers and market research seemed to validate our solution, this was one we wanted to be extra preventive on, since it’s often difficult to gauge until something is actually in the customers' hands.
“Usability” and “Feasibility” however were the biggest unknowns. Would the new feature be easy to find within the existing product and then use? Would we be able to leverage our existing 3rd party messaging platform for this? Would we need to build a new service? This is where we had the majority of our unknowns.
What visualizing the risks made clear was where to focus our first piece of work: we needed to ensure our assumed solution was easy to use and that we were confident we could build it. If we were able to de-risk this, we’d feel much more confident in investing further resources for a first working version, which in turn would be the best indicator for de-risking customer value. The conversation shaped how we tackled our first slice:
De-risking usability: we built a quick unmoderated prototype and released it to a small audience through an in-product banner.
De-risking feasibility: we did a proof of concept of the service and connected it to our 3rd party messaging service.
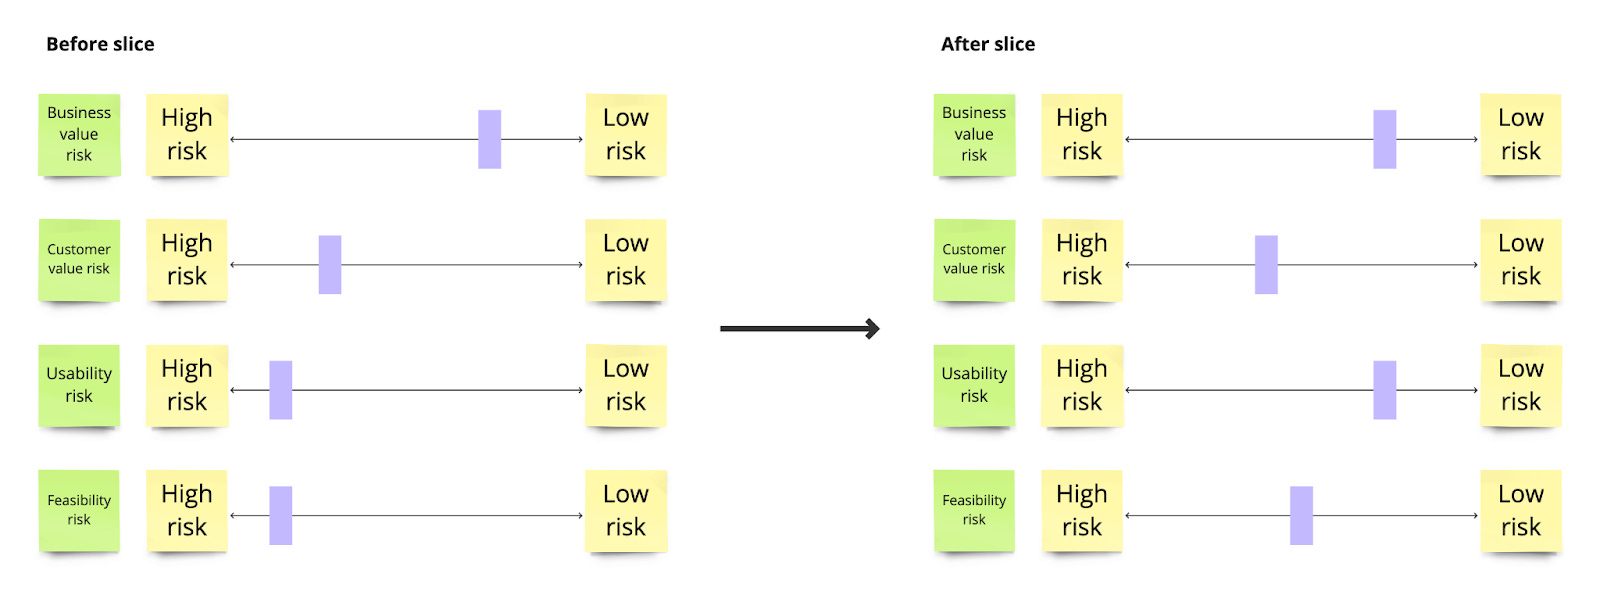
In a matter of days, we had meaningful data answering if it was easy to use (it was!) and whether we could build it (we could!). When we reassessed our risk profile, we determined:
“Business value” was unaffected
“Customer value” was slightly de-risked by the positive click rate we’d seen on the in-product banner and requests from customers to pilot the real feature.
“Usability” was significantly de-risked, as results had been universally positive
“Feasibility” was moderately de-risked, as we had a clear path forward, even if we had some questions on the full integration beyond the POC
Thinking through the scenarios at the start and our real-life example, the biggest value I’ve felt in visualizing the four risks is the way it focuses the conversation on how uncertain an initiative is today, whether we want to invest further in it, and, if so, where to focus first. The goal here isn’t to worry about being super accurate or obsess about millimeter nudges on the sliders, but rather the shared understanding that it can bring.
So, the next time you find your team hits a roadblock, try out the four risks sliders. Use them not as definitive measures, but as conversation starters towards de-risking your initiatives. Adapt it to your team's unique context, and see if it’s useful in your PM arsenal to enable better decision-making!
Thanks for reading Frameworking! If you enjoyed this post, sharing it helps a ton.